39 Wind Energy Facts & Statistics
Modern wind energy systems are significant contributors to our global shift toward renewable energy. We've compiled a list of 39 wind energy facts to give you an insight into the growth of the industry, the benefits of wind energy, and its contributions.
39 Wind Energy Facts

Growth in the Wind Energy Industry
#1- Our global capacity for wind energy is now over 651 GW, an increase of 10 percent compared to 20181
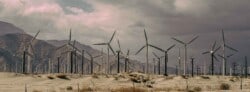
Wind turbines located at onshore and offshore farms convert mechanical energy into electricity supply to power our homes, private institutions, and public facilities. A grouping of wind turbines form wind farms, and a typical onshore wind turbine can generate enough electricity to power about 1500 homes.
Wind is a truly renewable resource. When the sun shines, hot air rises and cooler air replaces it, causing the flow of air we know as wind.
The wind power sector is enjoying consistent growth as several regions of the world continue to invest heavily in renewable energy. We can now find wind farms on every continent in the world and numerous offshore locations. We can attribute much of this progress to Europe's leadership by example over the past century.
Europe's return on its use of different forms of wind energy proves that wind is a cost-competitive energy source. As more regions recognize this, we expect to see more electricity-generating windmills and wind farms cropping up worldwide.
#2- 60.4 GW of wind energy capacity was installed globally in 2019, a 19 percent increase from installations in 2018 and the second-best year for wind historically1
Ongoing improvement
2019 represents the second-best year for wind power so far. Globally, we continue to see new wind turbines and modern wind systems installations.
However, as the facts below show, most of these new installations are primarily located in existing wind energy markets. Untapped markets, especially in developing regions of the world, are still struggling to measure up in the wind power market.
#3- In 2019, China, the US, the United Kingdom, India, and Spain made up 70 percent of the global wind installations1
#4- China and the US remain the world's largest onshore wind markets, together accounting for more than 60 percent of new capacity in 20191
#5- Asia Pacific (50.7 percent) is the leader in global wind power development, followed by Europe ( 25.5 percent), North America (16.1 percent), Latin America (6.1 percent), and Africa & Middle East (1.6 percent)1
#6- The costs of both onshore and offshore wind have plummeted by more than 50 percent on average in the last five years, with prices for new-build offshore wind declining by one-third from 2018 to 2019 alone1
Wind turbine technology continues to improve, and as with any developing technology, increased scale results in reduced production costs. Costs will continue to favor wind energy when we couple this with increasing demand as the world seeks to reduce its reliance on fossil fuels
Offshore Wind

#7- From being 1% of global wind installations by capacity in 2009, offshore wind grew to over 10% in 20192
The majority of wind energy comes from utility scale wind turbines ranging upwards from 100KWs. For too long, offshore wind to generate electricity remained an untapped potential. Of course, researchers knew the benefits. Higher wind speeds are available to harness offshore compared to onshore.
But until we had the modern turbines and systems that exist today, most of that knowledge remained theoretical. Today, offshore wind, where the same utility-scale wind turbines are installed out to sea, now accounts for about 10% of our global wind power installations.
#8- 30 years ago, there was not a single MW installed offshore, but with current market predictions, there could be up to 1,400 GW installed wind energy output worldwide over the next 30 years2
Although the cost (of offshore) is higher than onshore wind farm installation and maintenance, the renewable energy industry expects to see consistent growth in the former. These facts show that offshore wind farm projects are meeting expectations and are providing solutions to energy needs.
#9- With 6.1 GW of new capacity added, 2019 was the best year in history so far for the global offshore wind industry2
#10- At the end of 2019, Europe made up 75% of total global offshore wind installation2
#11- Japan built Asia's first offshore wind project with two units of V47-660 KW turbines in 20032
#12- In 2017, China passed the 1 GW annual offshore installation milestone; one year later, it surpassed the UK as the world's top market in new installations2
Environmental Impact of Wind Energy
#13- A 2.5 KW wind energy system can save 1-2 tonnes of CO2, and a 6 KW system can save 2.5-5tonnes of CO23
Our energy use is one of the biggest environmental polluters. Non-renewable energy sources (also known as fossil fuels) contribute to CO2 in our atmospheres when we mine, refine, and consume them.
CO2 is a natural greenhouse gas (GHG) that remains harmless as long as it is present in small quantities. However, in large quantities, as the world records today, CO2 buildup causes air pollution on a community level and climate change on a global level.
By replacing fossil fuels with renewable energy sources such as wind power, we reduce the amount of polluting GHGs we release into the atmosphere.
As the facts on wind energy in this section show, the wind is a viable solution to this problem. Wind energy produces 11g of CO2 for every kWh (kilowatt hour) of electricity generated; compared to coal at 980g, the environmental saving is considerable.
#14- According to the World Energy Commission, the use of one million KWh of wind power can save 600 tonnes of CO2 emission3
Flight risk?
#15- AWEA calculates that if we used wind energy to generate 100% of US electricity needs, wind energy generation would only cause one bird death for every 250 human-related bird deaths3
One common concern whenever a wind farm project starts in a community is the fate of their birds. Wind turbines are large, rotating metal slabs that could be dangerous to flying animals. They do, in some cases, cause deaths.
However, these statistics show that a typical wind turbine poses fewer risks to birds than many other threats that already exist, such as power lines and high-rise buildings
#16- Wind power would contribute to 6.3 Gt of CO₂ emissions reductions in 2050, representing 27% of the overall emissions reductions needed to meet Paris climate goals4
#17- IRENA predicts that onshore and offshore wind would generate more than one-third (35%) of total electricity needs, becoming the prominent generation source by 20504
Wind Energy in the US.
#18- The total installed wind capacity of the US is 107,319 MW[ref]
North America is currently the third-highest region for wind energy capacity. Primarily because of the wind installations in the US. Over the past few decades, we've seen consistent growth in the US' investments in diversifying its energy sources and electricity generated from renewable sources.
#19- From 2010 through 2018, the average installed cost for a wind plant in the US dropped 29%5
Modern wind turbines and modern electricity windmills are cheaper to produce and install. Largely thanks to innovation and the robust manufacturing sector. The US also sees legislative efforts to create policies that are better accommodating for the stakeholders in the wind energy industry to invest in renewable energy.
#20- The US makes North America the only region outside of Europe and Asia with commercial offshore wind capacity2
#21- The US wind industry installed 1,821 MW of new wind power capacity in the first quarter of 2020, a 117% increase over the first quarter of 2019[ref]
The US has a great deal of untapped offshore wind potential with only a handful of projects to date. Experts have suggested that offshore wind turbines could generate as much as four times more electricity than the US grid could handle, pointing to a massive development opportunity.
Wind Energy in Europe

#22- There are now 205 GW of installed wind power capacity in Europe: 183 GW onshore and 22 GW offshore6
#23- With 417 TWh generated, wind power covered 15% of the EU’s electricity demand in 20196
Until 2016, Europe led the rest of the world in wind power innovation and installations. The history of wind energy goes back considerably further than our current day electricity needs. For hundreds of years, people have used wind power to pump water and crush grain for bread and other food production.
Albert Beltz, a German physicist, is attributed as the pioneer of the first modern wind turbine and discovered wind energy theory. In his book, "Wind Energie" he laid out in 1919 how he foresaw the wind meeting our energy needs. Europeans created and installed the first modern wind turbines and other iterations of wind turbines after that.
We can still find signs of the continent's head start in their energy and electricity supply. As a source of energy, wind provides for 15% of the region's electricity demand. This capacity is more than any other region except China.
#24- Europe installed 15.4 GW of new wind power capacity in 2019. This is 27% more than in 2018 but 10% less than the record in 20176
#25- The UK installed the most wind power capacity in 2019 (2.4 GW). 74% of that was offshore wind6
#26- In 2019, Spain (2.3 GW), Sweden (1.6 GW), and France (1.3 GW) led the installation of onshore wind farms. Germany came fourth with 1.1 GW6
#27- By 2019, Denmark will be the country with the largest share of wind energy in its electricity demand (48%). Followed by Ireland (33%), Portugal (27%), Germany (26%) and the UK (22%)6
Wind Energy in China
#28- Wind energy constitutes the third largest energy source in China1
China's investments in harnessing mechanical energy are paying off. Wind now accounts for one-third of the country's energy supply. With a population of 1.4 billion people, the country has a lot of homes, private buildings, and public facilities to power. China continues to dedicate financial resources, land, and water bodies to installing wind farms.
#29- By 2019, China had a cumulative installed offshore wind capacity of 6.8 GW1
#30- With a coastline of over 18,000 km, China has more than 1,000 GW of technical potential for offshore wind1
Wind Energy in Other Regions
#31- In 2020, Chile now has 2.15 GW of wind capacity in operation, a further 1GW of capacity under construction, and more than 6 GW of approved wind projects1
#32- For India, wind is currently the second cheapest power source on the grid after solar at INR 2.81/kWh (USD 39.31/MWh) and nearly 35 percent less expensive than conventional fuels1
India does not only generate electricity using renewables. They also have wind and solar energy at cheaper costs than fossil fueled-sources. As the second-cheapest power source, the country can better manage the overall costs of wind turbines when compared.
This discovery and better resource allocation could hold the solution India needs to improve its electricity distribution. More installation of wind turbines and wind farms will mean better electricity supply for citizens and residents.
#33- Thailand's total wind installations were at 1,532 MW by 2019 – half of the 3 GW target set by the government for 20371
#34- Kenya currently has 335MW of installed wind capacity, with an additional 350MW forecast to come online by 20241
Projections for Wind Energy
#35- The Global Wind Energy Council expects the global wind energy market to grow on average by 4 percent each year1
Wind is an abundant, renewable resource. And as more countries explore the benefits of mechanical energy to generate electricity, experts predict an average of 4% yearly growth.
#36- Forecasters expect wind to remain the leading renewable technology in the United States through the 2020s5
The US facts about wind energy show that the country will continue investing in this renewable sector. To maintain their momentum, wind farm installation will become more commonplace.
Residents should expect to see more wind turbines lining the country's many coastlines. And these wind turbines will help power their homes, other private buildings, and public facilities. Whereas some may consider these installations unsightly, when wind produces electricity, less pollution follows.
#37- S&P Global Market Intelligence's Power Forecast team projects almost 55,000 MW of new wind installed in the US between 2020 and 20305
#38- IRENA predicts that Asia (mostly China) will continue to dominate the onshore wind power industry. They forecast China having more than 50% of global installations by 2050. Followed by North America (23%) and Europe (10%)4
#39- By 2030, industry experts estimate that around 5 GW to 30 GW of floating offshore wind capacity could be installed worldwide4
Plenty More to Come from Wind Energy
As many of the facts about wind energy above show, offshore installations are growing. More wind turbines now line coastlines around the globe and contribute increasing percentages to global electricity generation.
For a long time, the industry continued to invest in technology to take advantage of the high winds. In particular, we can only find those winds where there is water. Experts estimate that offshore installations will contribute significantly to our energy supply by 2030.
A growing contribution seems likely given the positive results running offshore farms show today. When it comes to clean energy, wind continues to be one of the most promising sources available.
As countries the world over accelerate their commitments to reducing needless fossil fuel energy production, wind energy investment looks set to continue to grow. As scale increases, the cost of turbine towers and installing modern wind farms seems set to come down. We'll see many more benefits from the power of the wind in years to come.
Jen’s a passionate environmentalist and sustainability expert. With a science degree from Babcock University Jen loves applying her research skills to craft editorial that connects with our global changemaker and readership audiences centered around topics including zero waste, sustainability, climate change, and biodiversity.
Elsewhere Jen’s interests include the role that future technology and data have in helping us solve some of the planet’s biggest challenges.
